#Load packages
library(tidyverse)
library(ggsci) #for easy color scales
library(patchwork) #to make multi-panel plots
library(palmerpenguins) # our fave penguin friends :)
Themes
Themes
Themes allow us to change the background color and most other aspects of a plot. There are a range of theme options within ggplot that will allow us to quickly make clean plots. The two that are most commonly used are theme_bw() and theme_classic()
Default theme (with terrible gray background)
ggplot(data=penguins, aes(x=species, y= bill_length_mm)) +
  geom_boxplot(aes(fill=species))+
  scale_fill_aaas()+
  labs(x = 'Species', y='Bill length (mm)', title='Penguin bill length by species')
Warning: Removed 2 rows containing non-finite values (`stat_boxplot()`).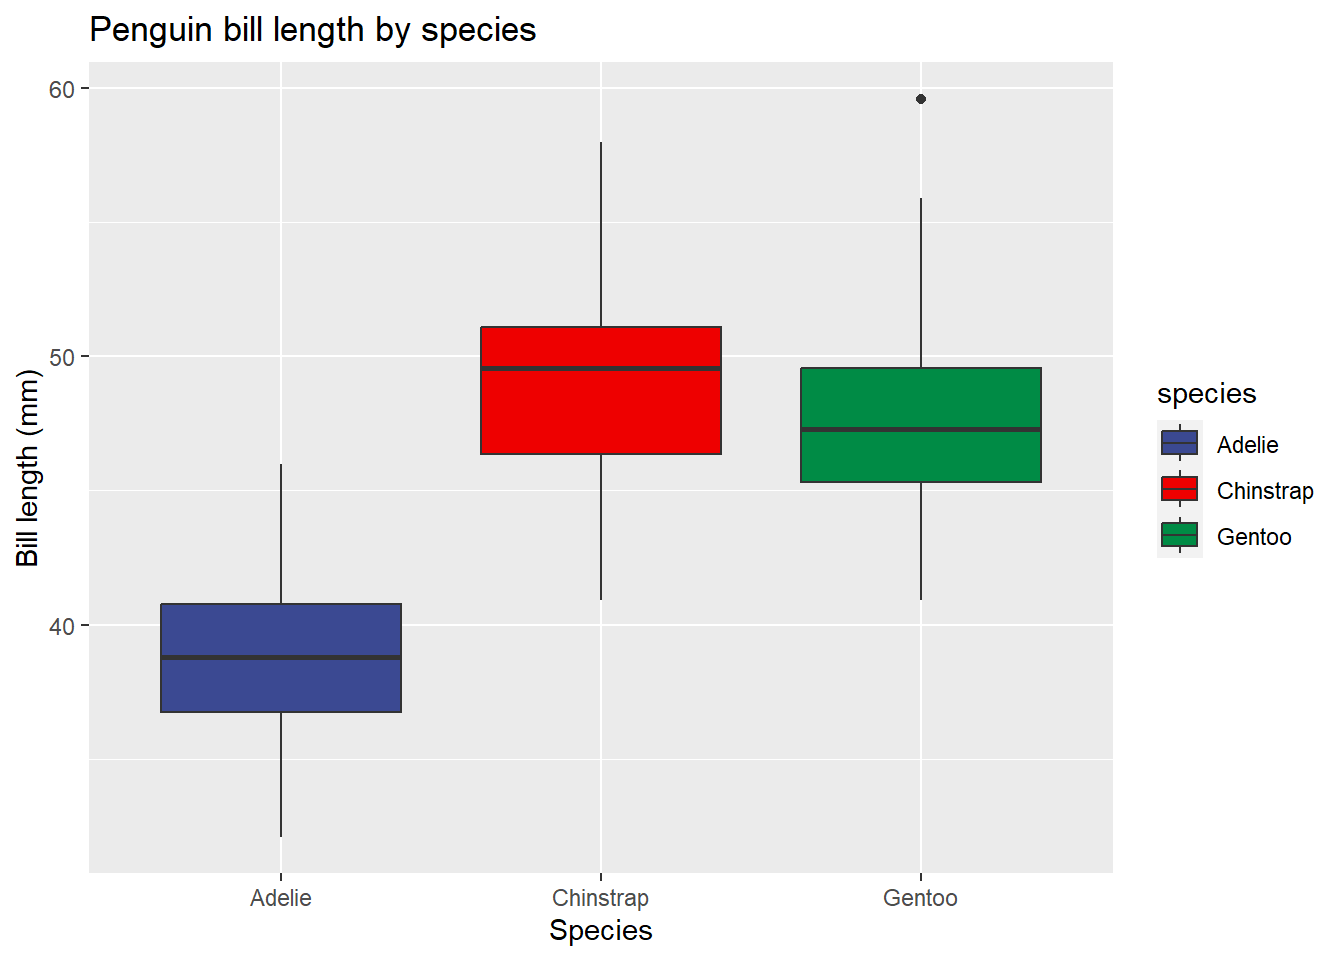
theme_bw() (removes gray background)
ggplot(data=penguins, aes(x=species, y= bill_length_mm)) +
  geom_boxplot(aes(fill=species))+
  scale_fill_aaas()+
  labs(x = 'Species', y='Bill length (mm)', title='Penguin bill length by species')+
  theme_bw()
Warning: Removed 2 rows containing non-finite values (`stat_boxplot()`).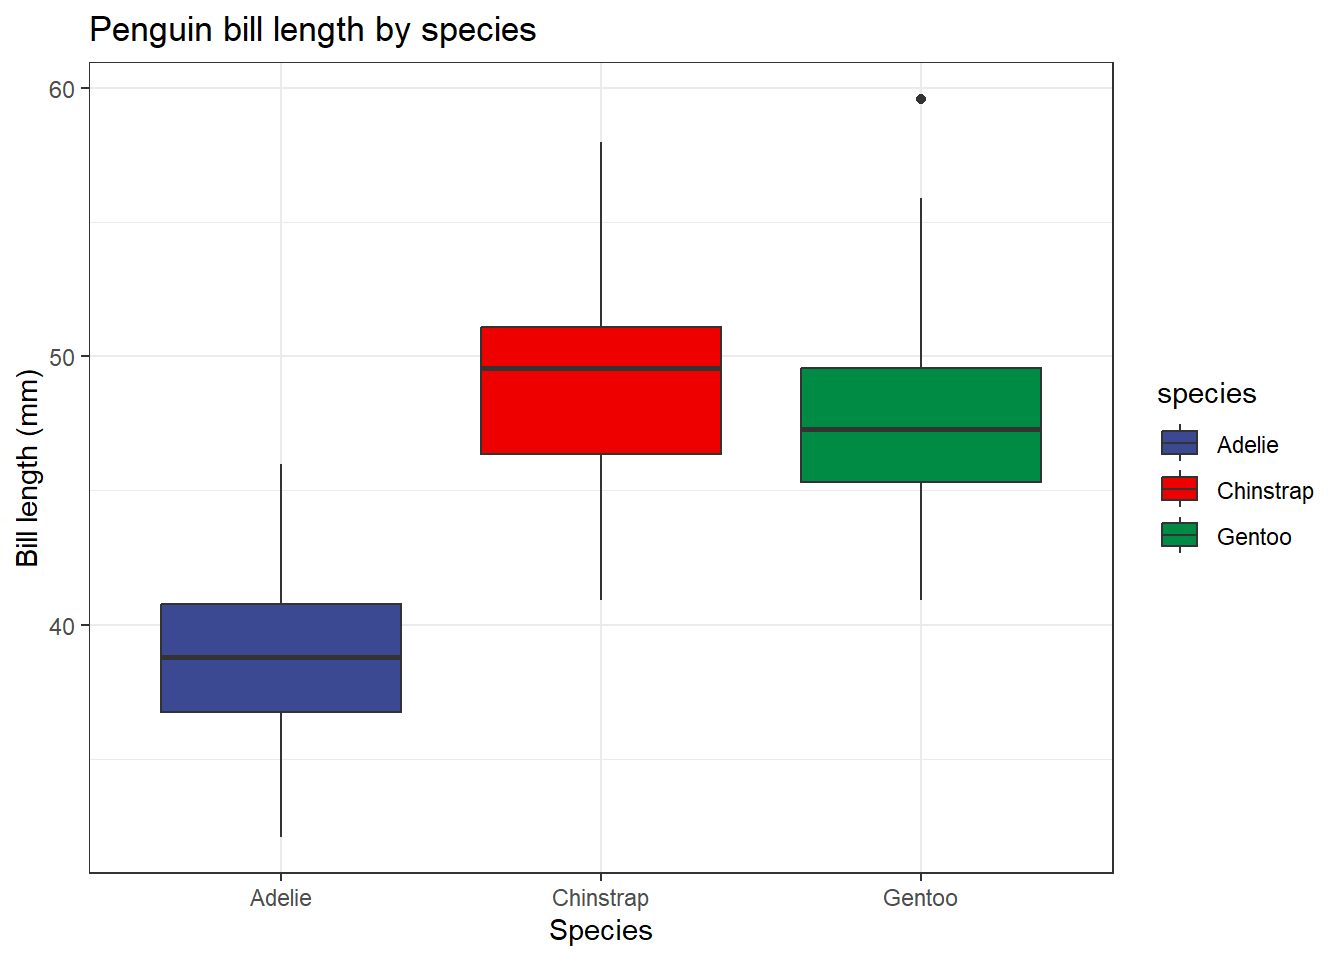
theme_classic() (removes gray and grid lines)
ggplot(data=penguins, aes(x=species, y= bill_length_mm)) +
  geom_boxplot(aes(fill=species))+
  scale_fill_aaas()+
  labs(x = 'Species', y='Bill length (mm)', title='Penguin bill length by species')+
  theme_classic()
Warning: Removed 2 rows containing non-finite values (`stat_boxplot()`).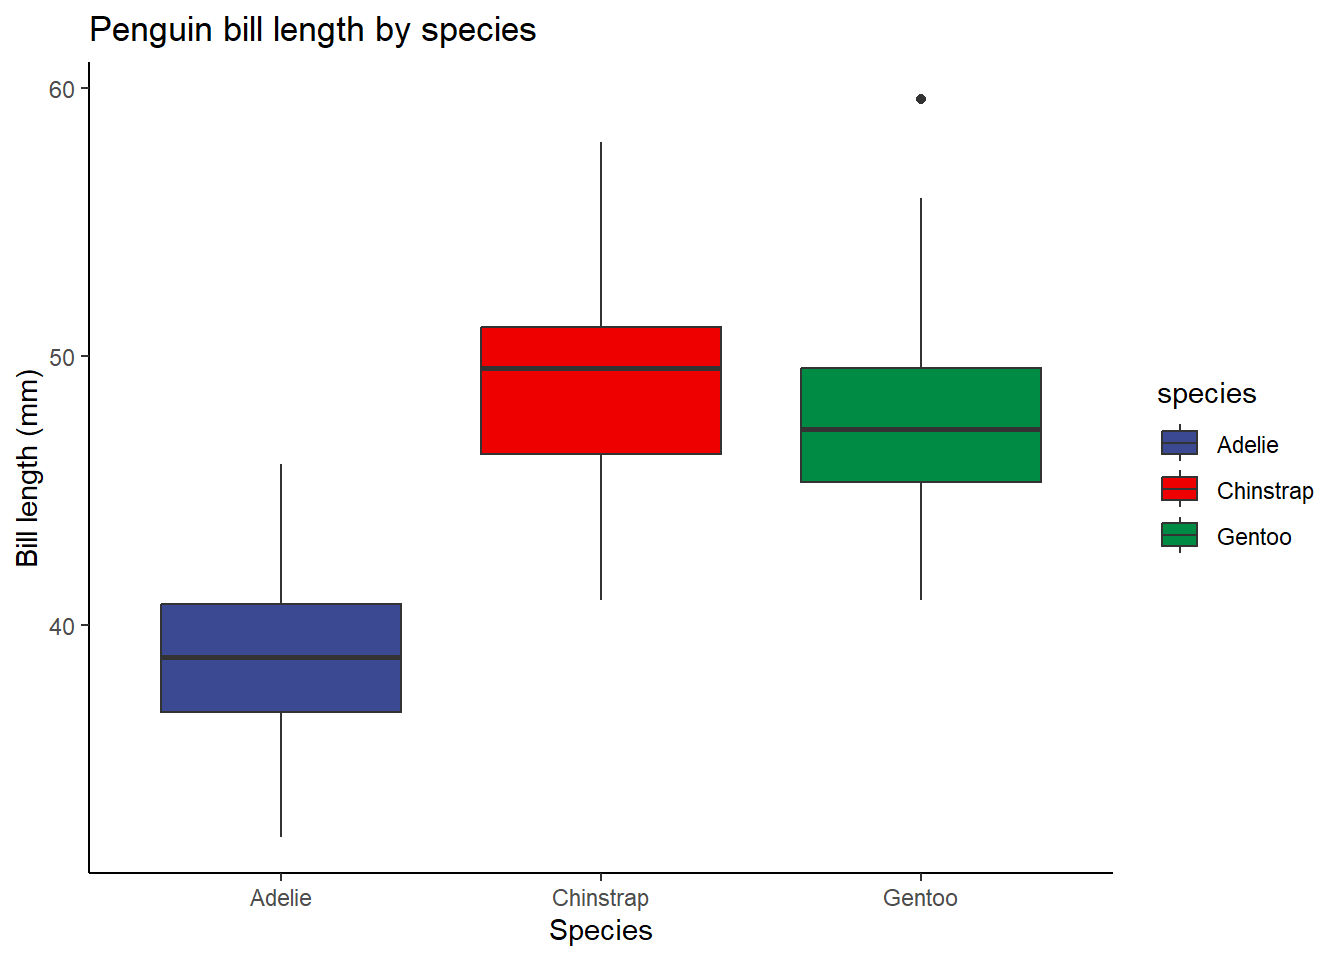
The theme() function in ggplot is SUPER flexible. You can pretty much do anything with it. This is key for customizing plots. I’d encourage you to play around with this a bit. Here is a great place to learn more and see examples.
##Some examples of using theme()
Changing text size
ggplot(data=penguins, aes(x=species, y= bill_length_mm)) +
  geom_boxplot(aes(fill=species))+
  scale_fill_aaas()+
  labs(x = 'Species', y='Bill length (mm)', title='Penguin bill length by species')+
  theme(text=element_text(size=24))
Warning: Removed 2 rows containing non-finite values (`stat_boxplot()`).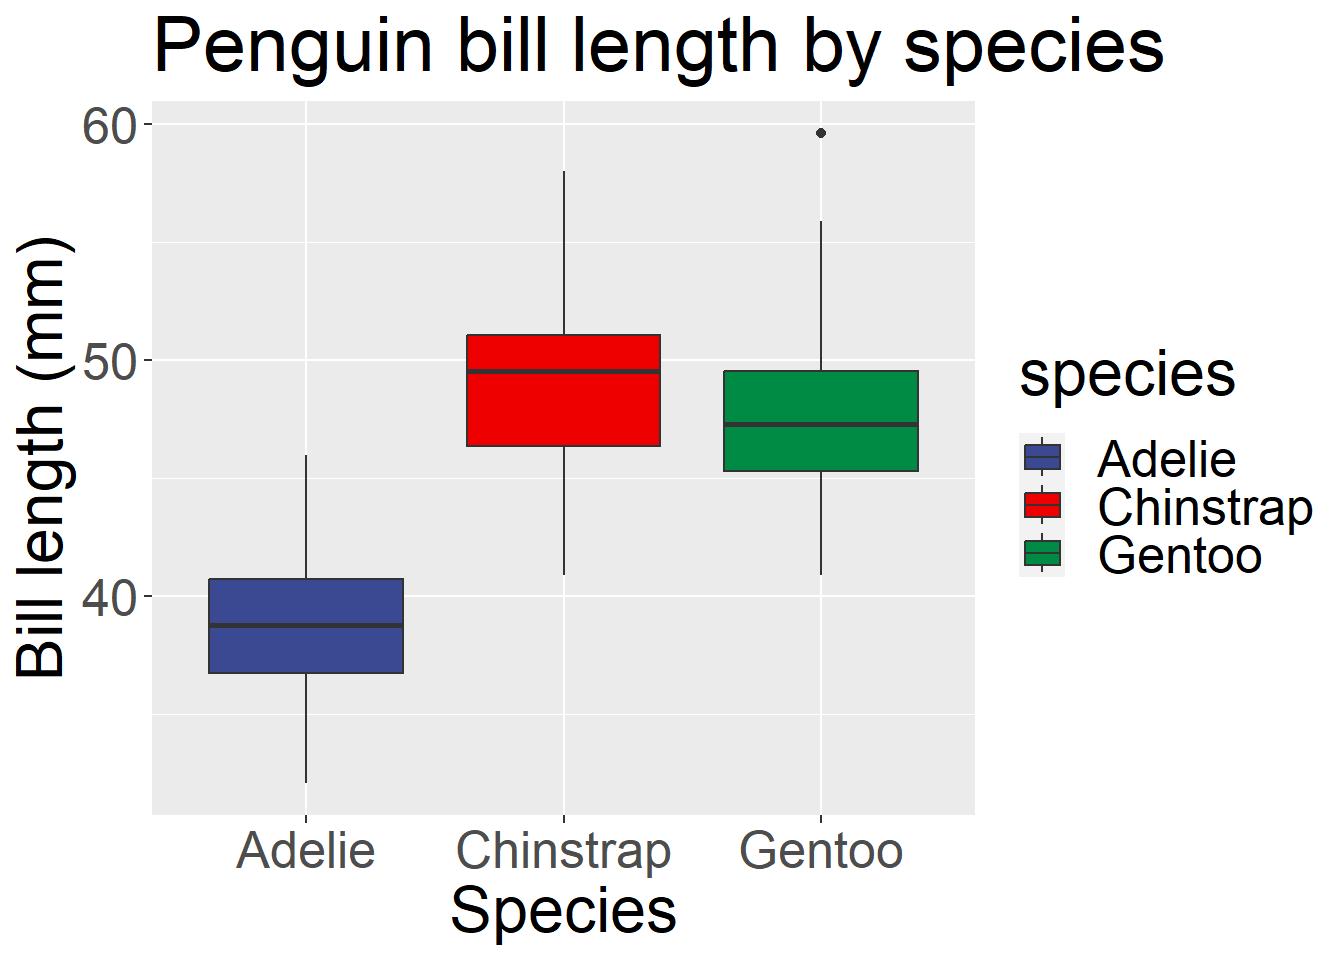
Remove the gray background
ggplot(data=penguins, aes(x=species, y= bill_length_mm)) +
  geom_boxplot(aes(fill=species))+
  scale_fill_aaas()+
  labs(x = 'Species', y='Bill length (mm)', title='Penguin bill length by species')+
  theme(text=element_text(size=24), panel.background = element_rect(fill="white")) #can use any color
Warning: Removed 2 rows containing non-finite values (`stat_boxplot()`).
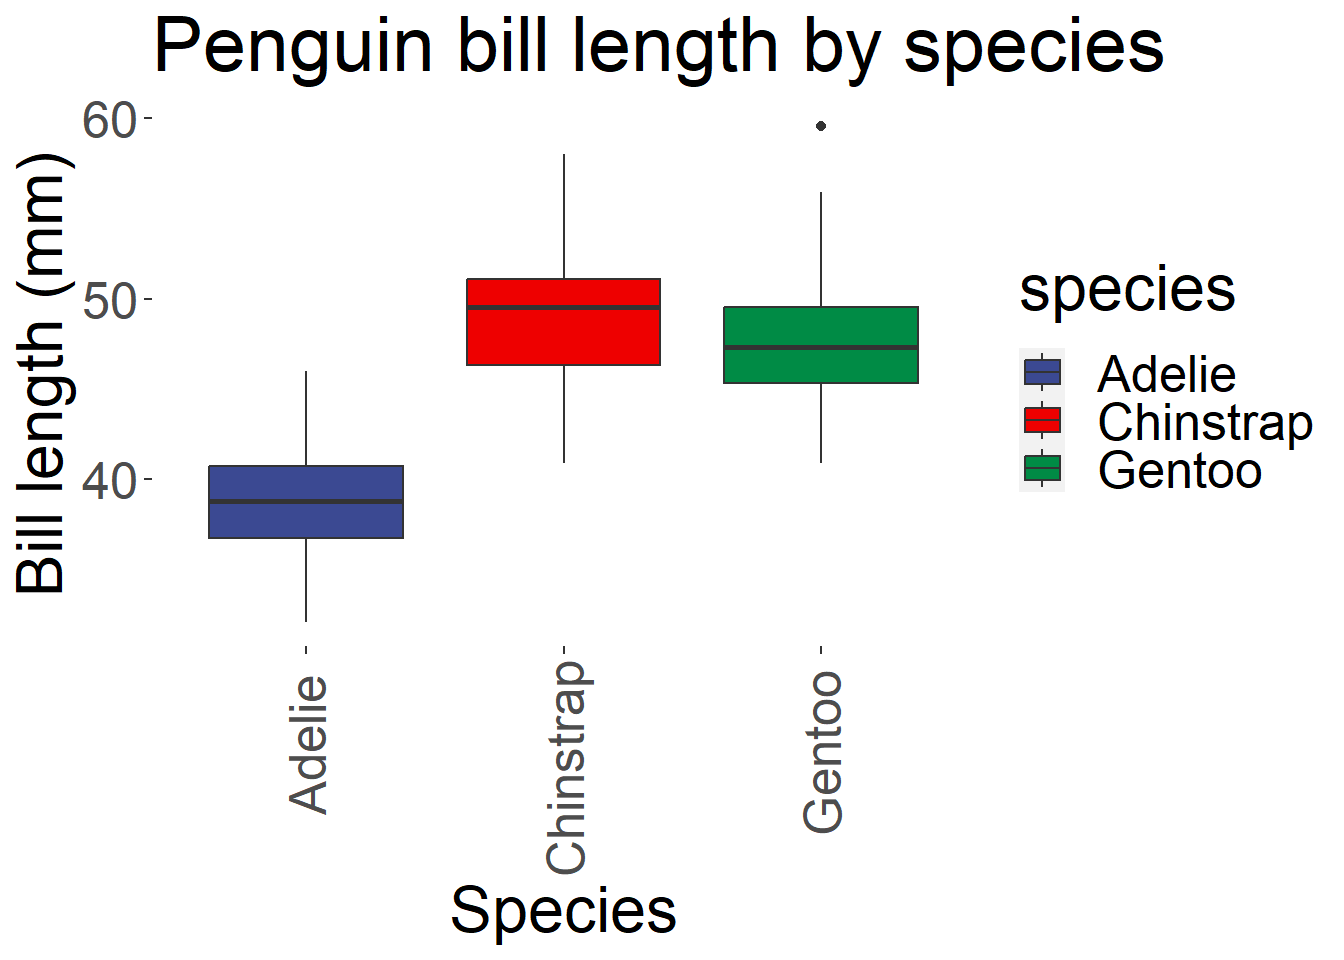
Turn the X-Axis text
ggplot(data=penguins, aes(x=species, y= bill_length_mm)) +
  geom_boxplot(aes(fill=species))+
  scale_fill_aaas()+
  labs(x = 'Species', y='Bill length (mm)', title='Penguin bill length by species')+
  theme(text=element_text(size=24), panel.background = element_rect(fill="white"), axis.text.x=element_text(angle=90, vjust=0.5, hjust=0.8)) #can adjust vertical and horizontal text positions
Warning: Removed 2 rows containing non-finite values (`stat_boxplot()`).