#Load packages
library(tidyverse)
library(ggsci) #for easy color scales
library(patchwork) #to make multi-panel plots
library(palmerpenguins) # our fave penguin friends :)Axes labels and Titles
titles and axis labels
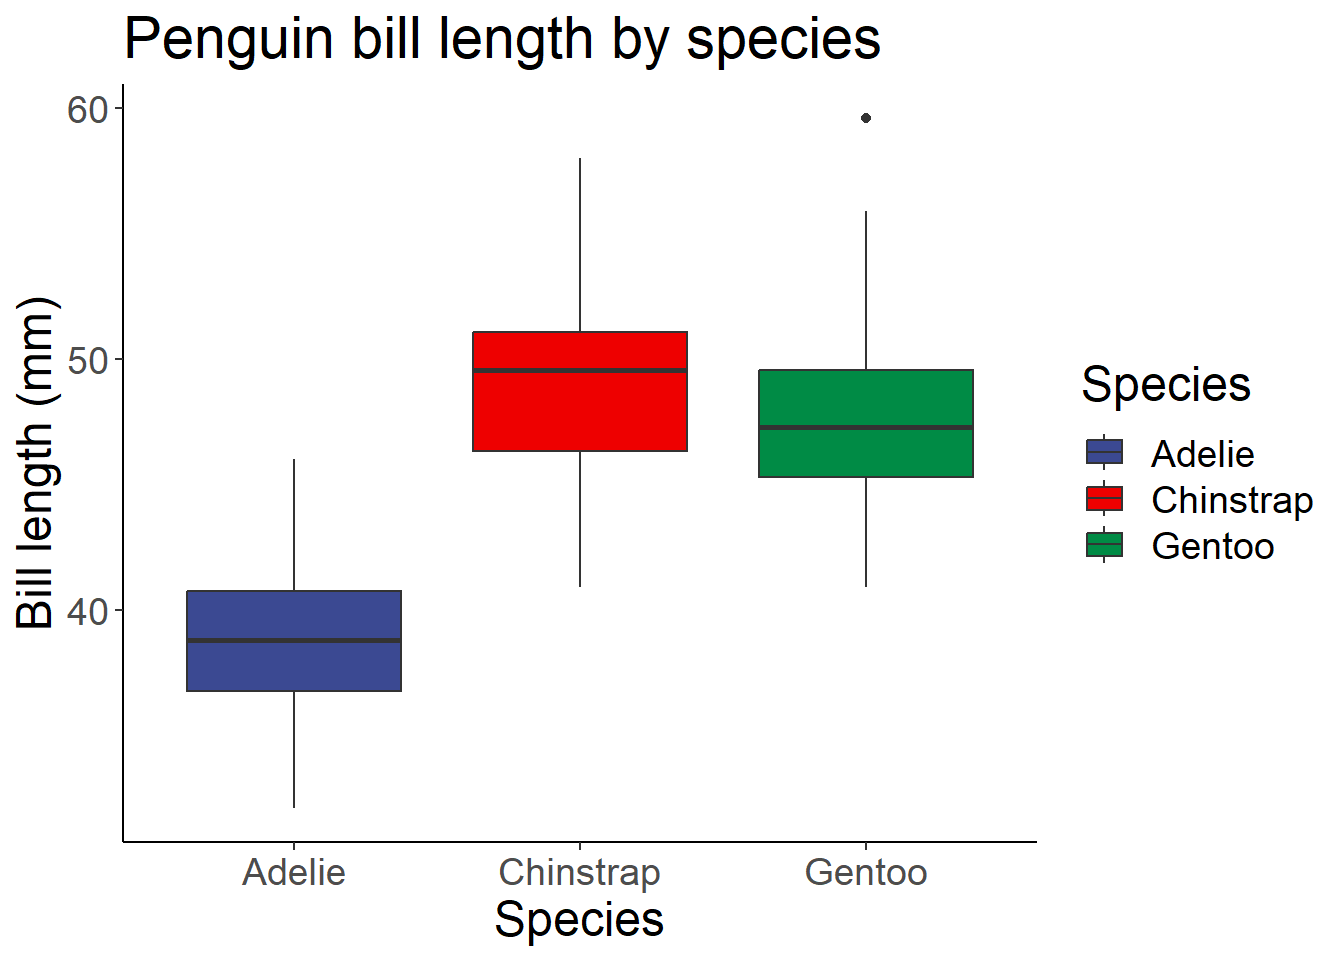
Titles and axis labels are easy to add and change in ggplot! We simply add another line to our code. NOTE you can also add a subtitle, caption, or change the legend title using labs!
ggplot(data=penguins, aes(x=species, y= bill_length_mm)) +
  geom_boxplot(aes(fill=species))+
  scale_fill_aaas()+
  theme_classic()+
  labs(x = 'Species', y='Bill length (mm)', title='Penguin bill length by species', fill='Species')+ #here I change the x-axis and y-axis labels, add a title, and change the legend label (to capitalize the 'S' in 'species')
  theme(text=element_text(size=18))
Warning: Removed 2 rows containing non-finite values (`stat_boxplot()`).