#Load packages
library(tidyverse)
library(ggsci) #for easy color scales
library(patchwork) #to make multi-panel plots
library(palmerpenguins) # our fave penguin friends :)
Colors
Colors
We can change colors conditionally or manually.
Conditional Color Change To change colors conditionally, we use color= or fill= within an aes() call.
Here I have changed the outline color (color=) for a series of boxplots based on species
ggplot(data=penguins, aes(x=species, y= bill_length_mm, color=species)) +
  geom_boxplot()
Warning: Removed 2 rows containing non-finite values (`stat_boxplot()`).
I can also change the fill of the boxplots
ggplot(data=penguins, aes(x=species, y= bill_length_mm, fill=species)) +
  geom_boxplot()
Warning: Removed 2 rows containing non-finite values (`stat_boxplot()`).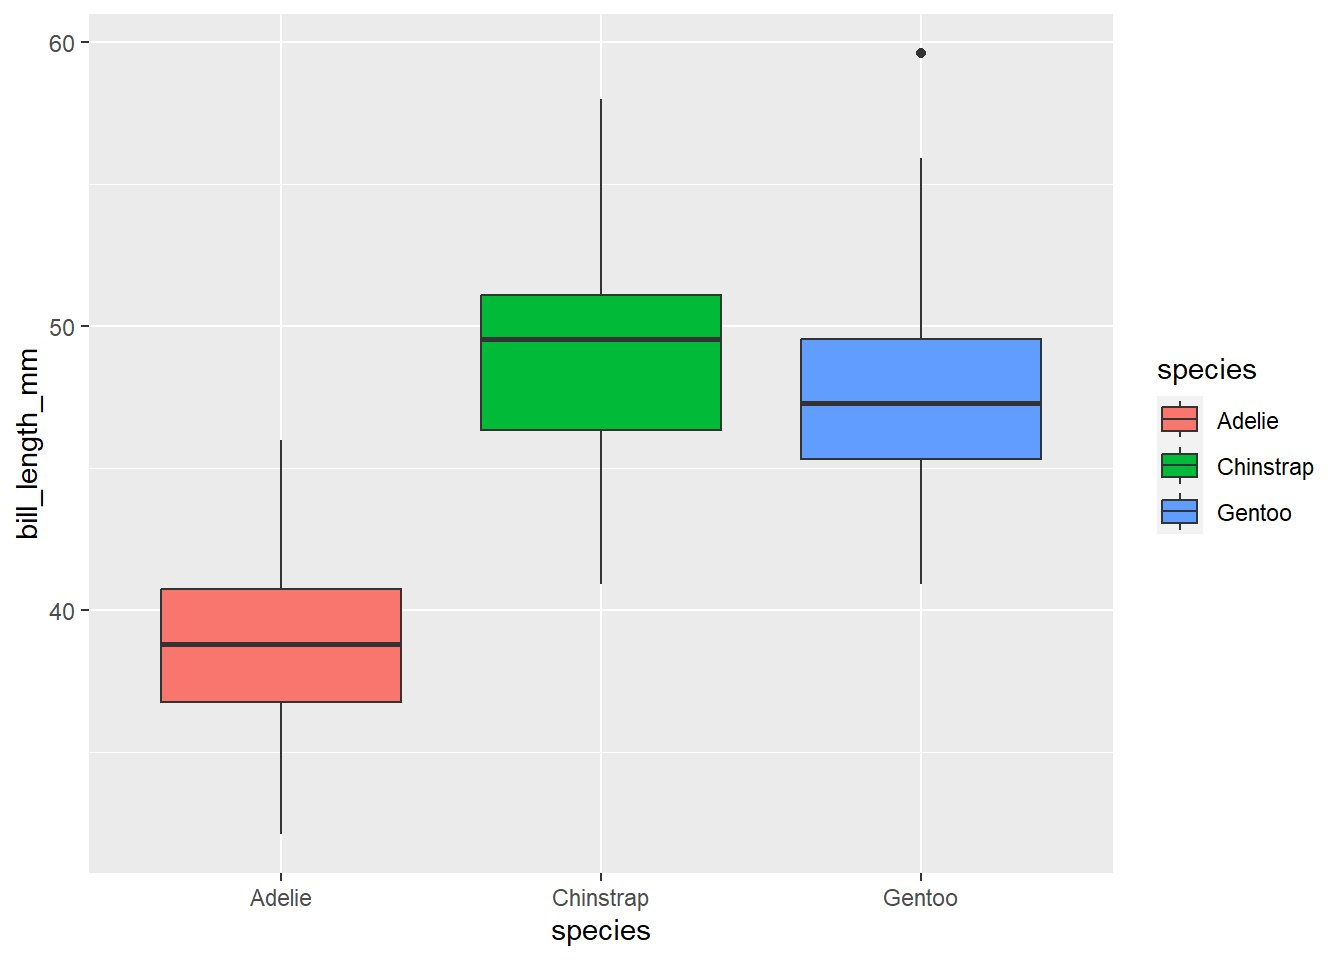
Manual Color Change We can also change colors manually by using one of many options within ggplot. scale_color_manual (or scale_fill_manual) is the easiest. We simply define colors we want to use by name or hexcode.
ggplot(data=penguins, aes(x=species, y= bill_length_mm)) +
  geom_boxplot(aes(fill=species))+
  scale_fill_manual(values=c('red', 'black', 'blue'))
Warning: Removed 2 rows containing non-finite values (`stat_boxplot()`).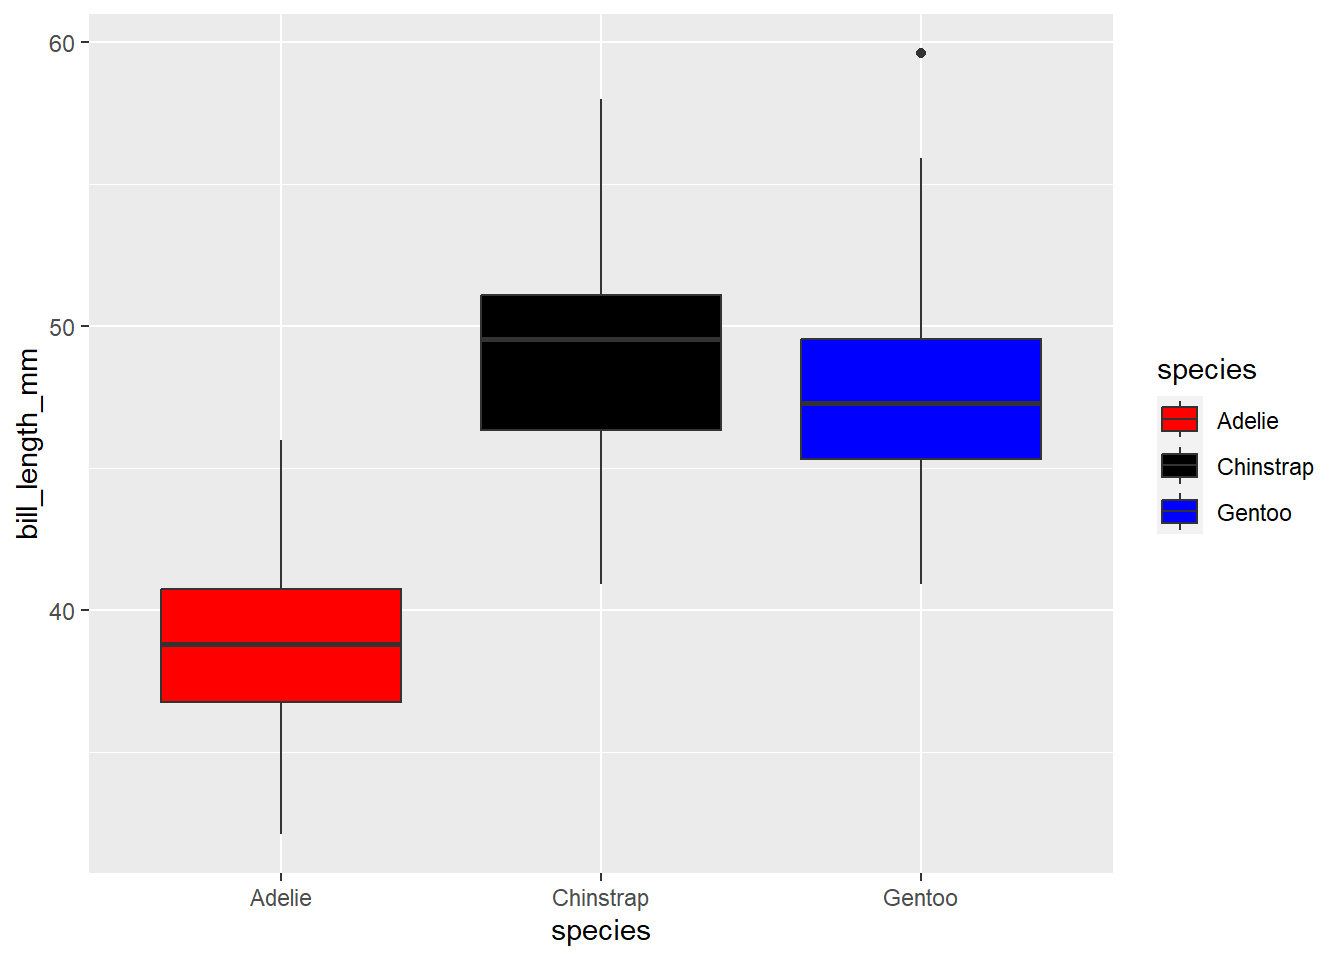
Here’s a giant table of color options in ggplot 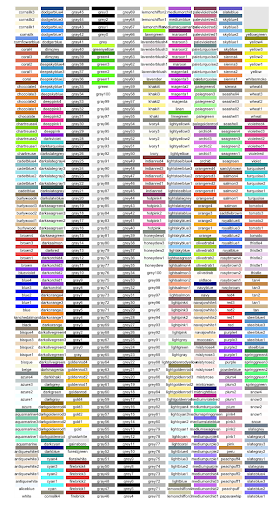 You can also make your own color palette and apply that to your figure!
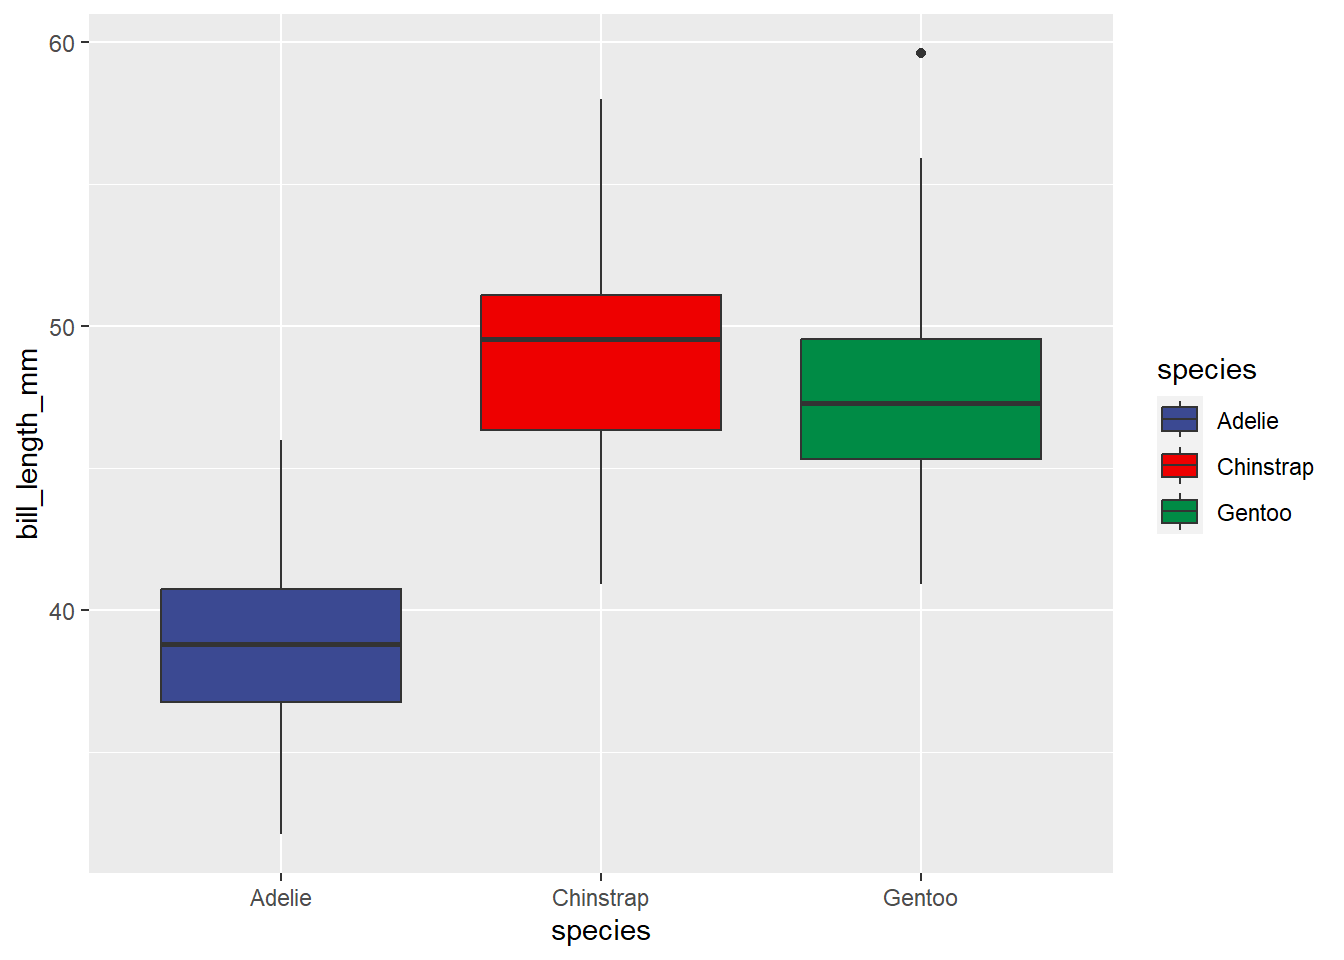
mypal<-c('dodgerblue', 'forestgreen', 'coral') # here I've made a 3 color palette

ggplot(data=penguins, aes(x=species, y= bill_length_mm)) +
  geom_boxplot(aes(fill=species))+
  scale_fill_manual(values=mypal)
Warning: Removed 2 rows containing non-finite values (`stat_boxplot()`).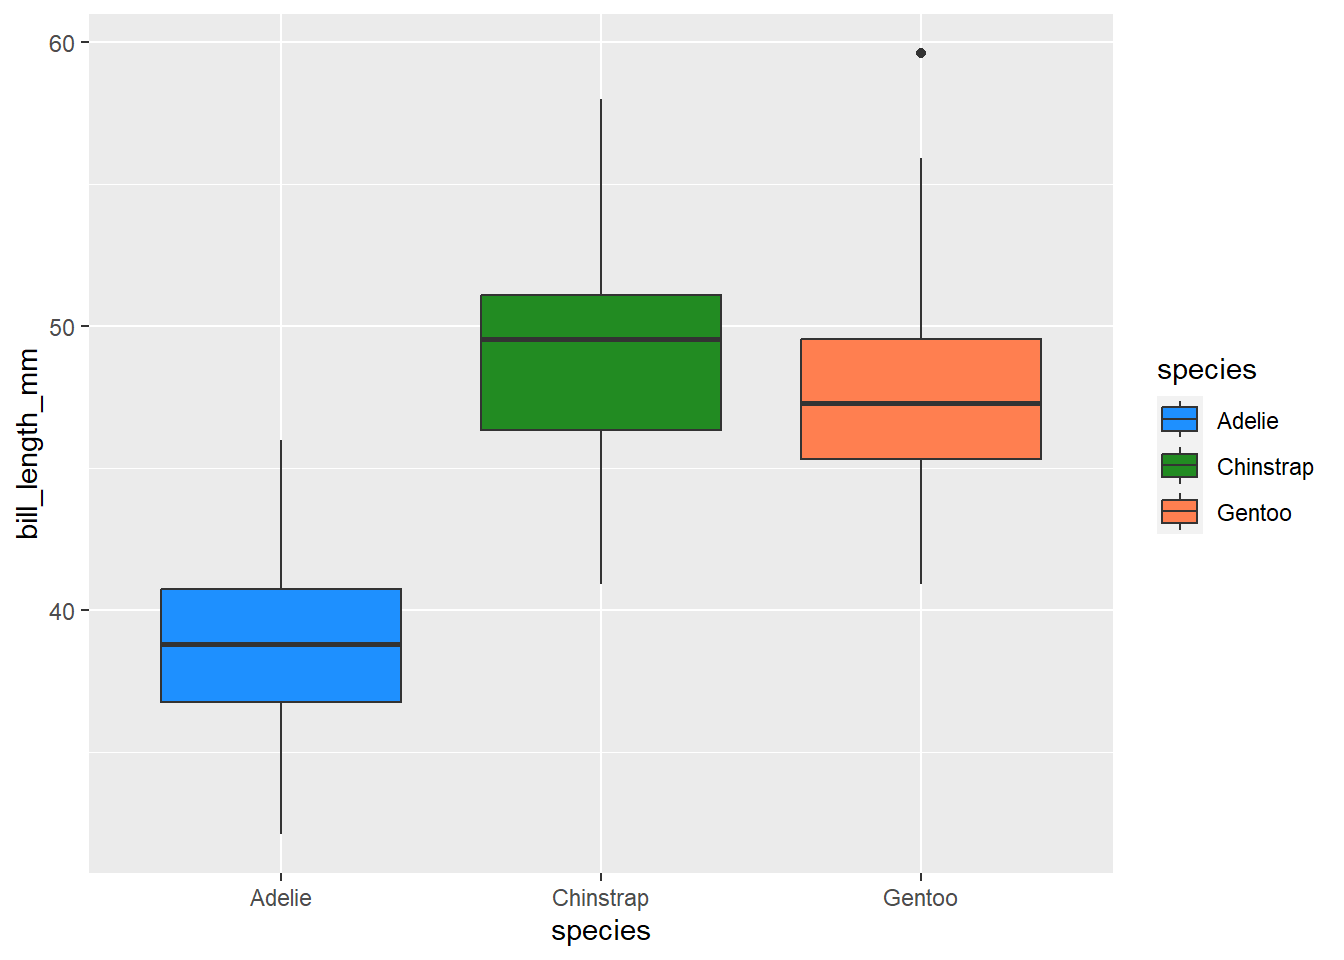
You can use the package RColorBrewer to make palettes as well. I’ll let you explore that one on your own!
Finally, EASY and nice looking palettes with ggsci ggsci is a simple and neat package that allows us to use scientific journal color themes for our data (usually colorblind friendly and nice looking). we simply change our “scale_color_manual” to “scale_color_palname” where “palname” is one of many provided by ggsci. For example, we might use scale_color_aaas()
ggplot(data=penguins, aes(x=species, y= bill_length_mm)) +
  geom_boxplot(aes(fill=species))+
  scale_fill_aaas()
Warning: Removed 2 rows containing non-finite values (`stat_boxplot()`).